The Canadian crude oil supply chain faces increasingly complex constraints. Pipeline congestion, apportionment, rail bottlenecks, storage limitations, and fluctuating price differentials collectively erode the netback profitability. In this article, we present a mathematically formulated, data-integrated approach for optimizing the upstream-to-downstream movement of crude oil, enabling producers to make data-informed, profit-maximizing, logistical, and commercial decisions.
Most Canadian crude oil is landlocked with limited access to global markets. While pipelines remain the dominant mode of transportation, they frequently operate at or near capacity, leading to apportionment and substantial volatility in realized netbacks. Rail offers a more flexible alternative, but at a higher cost and with operational challenges such as scheduling constraints and turnaround times. In this complex environment, producers must continually manage contractual nominations, storage utilization, and pricing differentials in real time.
A centralized optimization model can be instrumental in effectively addressing these challenges. By integrating data from operational systems, market signals, and infrastructure availability, the model provides prescriptive recommendations that guide tactical actions and strategic planning. The key decision areas include routing, batching, storage management, and nomination scheduling. The primary objectives of the optimization framework are as follows:
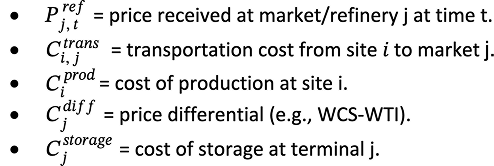
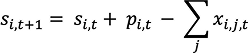
This supply chain optimization problem can be formulated as a multiperiod mixed-integer linear program (MILP). In this case, the core objective is to maximize netback revenue across all upstream production sites 𝑖, destination markets 𝑗, and time periods 𝑡. Netback is defined as the realized price at each destination minus the associated costs, including the transportation, production, storage, and pricing differentials.
Given that the primary goal is to maximize netback revenue for producers, the objective function can be formulated as follows:
1. Transportation capacity constraints
4. Batch and blending rules (binary constraints where necessary)
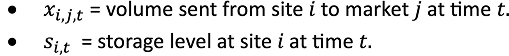
The binary restriction xi, j, t, k∈{0, 1} is applied when only one batch type can be selected or dispatched per route in each period, such as when operational rules require discrete batching decisions. For scenarios involving continuous flow volumes, the variable can be relaxed to xi, j, t, k∈[0, U] , where U is the upper bound defined by capacity or contractual limits. Logical batching constraints such as mutual exclusivity or minimum run sizes can then be handled separately within the model.
Additional operational, regulatory, or economic factors not explicitly represented here (e.g., quality specifications, downstream blending compatibility, or emission constraints) can also be incorporated into the optimization framework as required.
The proposed optimization framework can serve as a comprehensive decision support system that incorporates real-world market signals, infrastructure constraints, and operational rules. It is purpose-built to reflect the economic trade-offs and logistical challenges unique to Canada’s crude-oil producers. The core intelligence of the model is reflected in the following key capabilities.
Critically, this kind of governance isn’t just about technology—it’s about people, culture and process. Governance frameworks must reflect the values of the communities they serve. That means grounding decision-making in transparency, equity, and meaningful stakeholder engagement.
At ThoughtsWin, we help local and regional organizations build AI governance models that are actionable, adaptable, and aligned to real-world needs. Our work spans public and private sectors—from municipalities seeking intelligent infrastructure to agencies digitizing legacy decision-making processes.
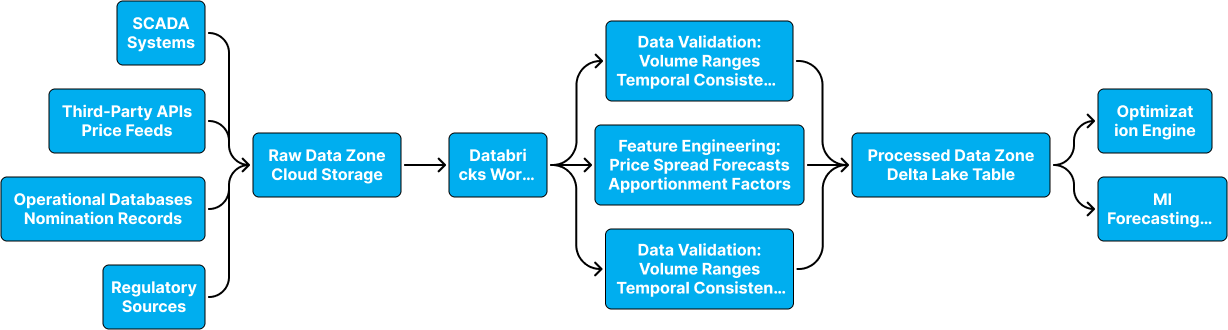
To ensure robust optimization performance, Databricks Lakehouse architecture can be implemented with Delta Lake storage. Built on the Medallion Architecture, this framework organizes data into Bronze (raw), Silver (cleaned), and Gold (curated) layers to ensure traceability, scalability, and high-quality decision-making. Databricks pipelines are designed for both real-time streaming and batch processing, depending on the nature and urgency of the input.
Data quality is embedded throughout the pipeline. Built-in validation rules, freshness checks, and schema enforcement help maintain reliability. Delta Lake’s versioning, lineage, and ACID properties support auditing and rollback. Together, these controls ensure that the optimization decisions are based on clean, current, and trustworthy data.
The Bronze layer ingests data in its raw, unprocessed form, preserving fidelity, and enabling traceability. Real-time data, such as market prices and SCADA telemetry, are captured via streaming APIs or IoT streams, whereas nomination data, rail logs, and regulatory updates arrive through scheduled batch feeds.
This layer prioritizes ingestion completeness and metadata tagging over structure or quality.
In the Silver layer, the data is validated, standardized, and aligned across sources. This includes unit conversion, timestamp harmonization, anomaly detection, and cross-system joins. Quality checks, such as outlier filtering and referential integrity, are applied to ensure consistency before downstream modeling.
The Silver layer acts as the foundation for accurate optimization of the inputs.
The Gold layer delivers structured, business-ready datasets that are fed directly into optimization models, dashboards, and simulations. These include netback calculations, capacity-adjusted transport options, and storage strategies for various scenarios.
The data here are fully validated, refreshed in real-time or batch, and easily consumed across business teams through Databricks notebooks and Power BI dashboards.
The following data inputs are required to enable actionable optimization.
To implement the optimization engine, we begin by building a mixed-integer linear programming (MILP) model in Python using Pyomo or PuLP. It can be configured to interface with Gurobi for high-performance solving, with optional fallback to open-source solvers such as the COIN-OR Branch and Cut (CBC) for cost-sensitive environments. Machine learning forecasts, developed in scikit-learn and trained on historical data, can be integrated to account for uncertainty in factors such as WCS-WTI spreads and refinery demand.
Next, we establish a dynamic re-optimization workflow that ingests real-time inputs such as apportionment levels, pricing differentials, and refinery offtake forecasts. These inputs trigger automated model runs that update the recommendations for the transport mode, storage allocation, and nomination schedules. Optimizations can be scheduled (hourly or daily) or triggered on demand using a callable API.
To support the scenario analysis, we enable parameterized inputs that reflect infrastructure changes, regulatory shifts, or new blending strategies. Scenarios can be triggered via an API or scheduled workflows with outputs, including dispatch volumes, netback forecasts, and contingency routing, sent to dashboards or downstream systems.
For long-term adaptability, we incorporate a reinforcement learning (RL) module that uses past apportionment and netback outcomes to refine nomination strategies. Beginning with a pilot in which the RL agent is trained using feedback from historical data, strategy accuracy gradually improves as market conditions evolve.
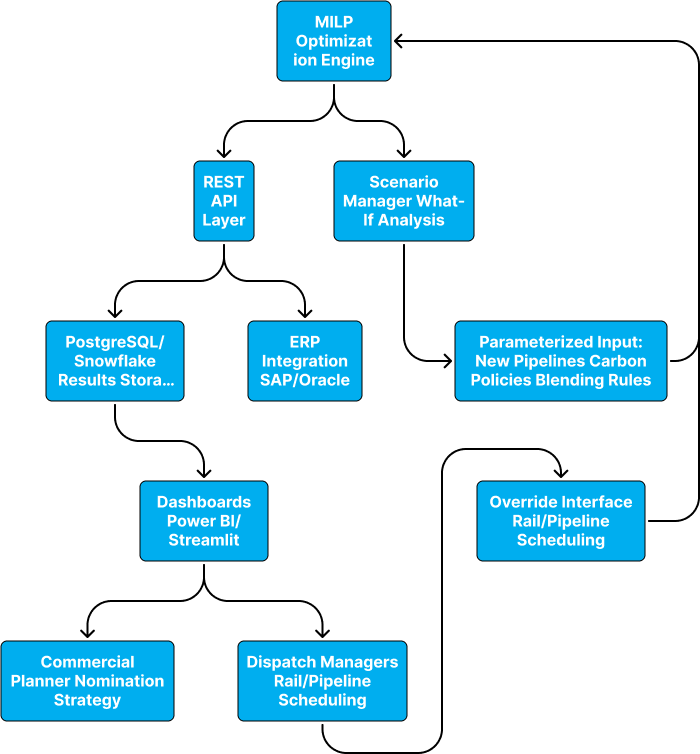
To ensure seamless interaction across technical and commercial teams, a deployment architecture can be built to emphasize modularity, scalability, and role-based access. The core optimization engine is exposed via RESTful APIs that are connected to a version-controlled data backend, such as PostgreSQL or Snowflake, thereby enabling reliable input/output management.
On the front end, interactive dashboards—developed using tools such as Dash, Streamlit, or Power BI—provide planners and analysts with real-time access to optimization outcomes. These dashboards allow users to explore scenario results, interpret model recommendations, and make data-informed decisions. The key decision support metrics to be tracked are as follows:
For enterprise-level visibility, reporting outputs can also be integrated with Power BI or Tableau to consolidate performance tracking and strategic insights across teams. For users such as dispatch managers and commercial planners, the system can be built to support operational overrides (e.g., enforcing rail transport owing to maintenance) and the ability to initiate ad hoc optimization runs via API or dashboard triggers.
All model runs are logged and versioned using MLflow (whenever possible) to ensure full auditability and reproducibility. Final outputs, such as daily nomination schedules, storage forecasts, and strategy comparisons, can be exported as follows:
The crude oil supply chain optimization system can deliver measurable improvements in profitability, efficiency, and risk management. Producers can improve their net back revenue by dynamically aligning transportation, storage, and marketing strategies with real-time market conditions and infrastructure constraints. The system enables smarter use of blending, rail arbitrage, and storage timing to manage apportionment risk, avoid over-nomination penalties, and optimize delivery economics.
In addition to short-term gains, the platform can support long-term strategic planning, improve transparency, and enhance regulatory readiness. This creates a centralized, version-controlled environment for managing nomination logic, making monthly submissions more consistent and auditable. Key benefits include:
The optimization framework has strong potential for expansion into more advanced, resilient, and sustainability-aligned decision-making. Future enhancements could aim at increasing the predictive power, operational agility, and ESG integration of the system. These extensions make the platform more adaptive to uncertainty, respond to real-time events, and align with environmental targets. Planned roadmap initiatives include the following.
By integrating mathematical optimization, scalable data engineering, and intuitive deployment, the proposed system transforms the Canadian crude oil supply chain into a dynamic, responsive, and economically optimized operation. It empowers producers with the intelligence and agility required to navigate infrastructure constraints and volatile market conditions effectively. The key outcomes of the system are as follows:
ThoughtWins (TWS) brings this vision to life. With deep expertise in energy analytics, optimization modeling, and cloud-native architecture, TWSs help upstream and midstream operators implement this solution at scale, from building custom MILP models and data pipelines to deploying real-time dashboards that deliver immediate insights.